Environment and Climate Change Canada’s National Hydrological Service is responsible for measuring and monitoring the volumetric flow rate, or ‘discharge’, and water level, or ‘stage’, of rivers and lakes across the country. Together with funding partners including provinces, territories, and local conservation authorities, we operate thousands of hydrometric stations throughout Canada. These hydrometric stations provide critical data used by scientists, engineers, policy makers, and communities alike.
Our role as Hydrometric Technologists requires field and office work. We visit stations within our region several times per year to verify data and perform routine maintenance. In the office, we organize and interpret data, maintain equipment, and plan and prepare for upcoming field trips. Our work allows Canadians to better understand how much water moves through certain rivers, creeks, and other waterways at any given time.
The data we collect supports a variety of activities:
- flood forecasting,
- water-resource management,
- environmental monitoring,
- infrastructure design,
- power generation, and
- even recreational planning.
This provides baseline information that allows Canadians to sustainably manage and use one of the country’s most vital and dynamic resources.
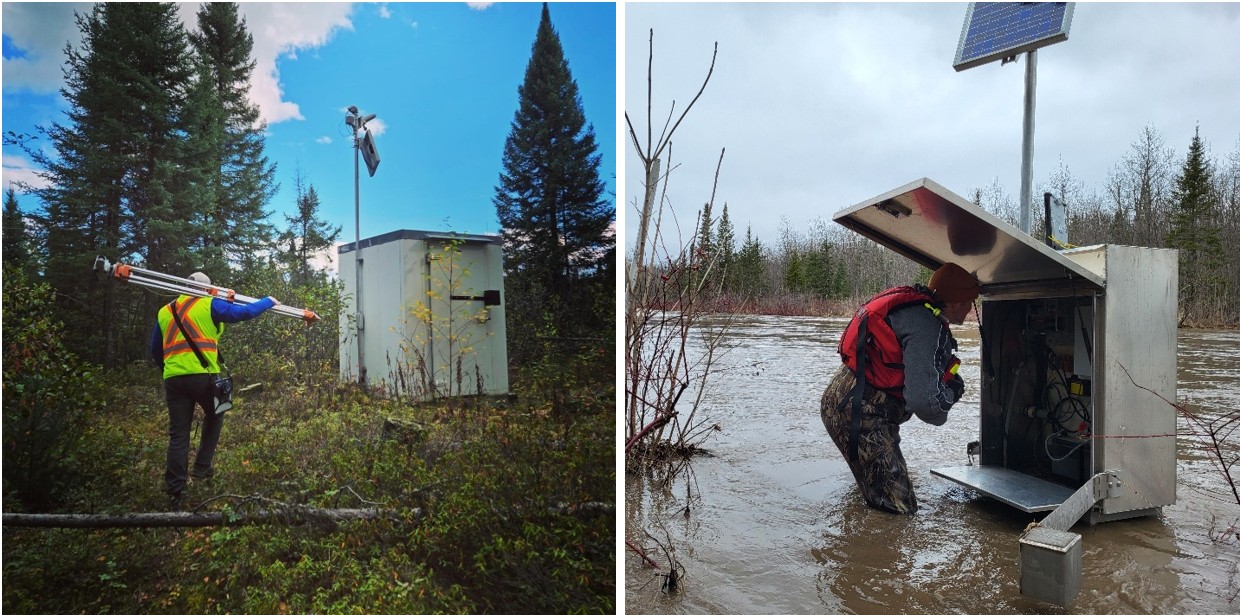
Left: Craig Paul bringing surveying equipment to station 04FA002 – Kawinogans River Near Pickle Crow, 2024-10-02 (photo by Sean Arruda).
Right: Michael Dodd-Smith reviewing logger data during a high-water event at station 02AB027 – Whitefish River Near Stanley, 2025-04-29 (photo by Tanner Booth).
To understand how much water is flowing through a river, we measure two values: the water level (stage) and the flow rate (discharge).
Measuring stage
At each hydrometric station, in-water sensors continuously record the stage of the river. The stage is the height of the river’s water level compared to a fixed point nearby. These sensors are the heart of every station, quietly collecting and transmitting data throughout the year. During regular station visits we also verify the accuracy of the recorded stage data and adjust the sensors if needed. These checks are essential to verify that the automatic sensors are reading correctly and maintain the integrity of the long-term record. The data collected remotely is used to model how much water is flowing in the river.
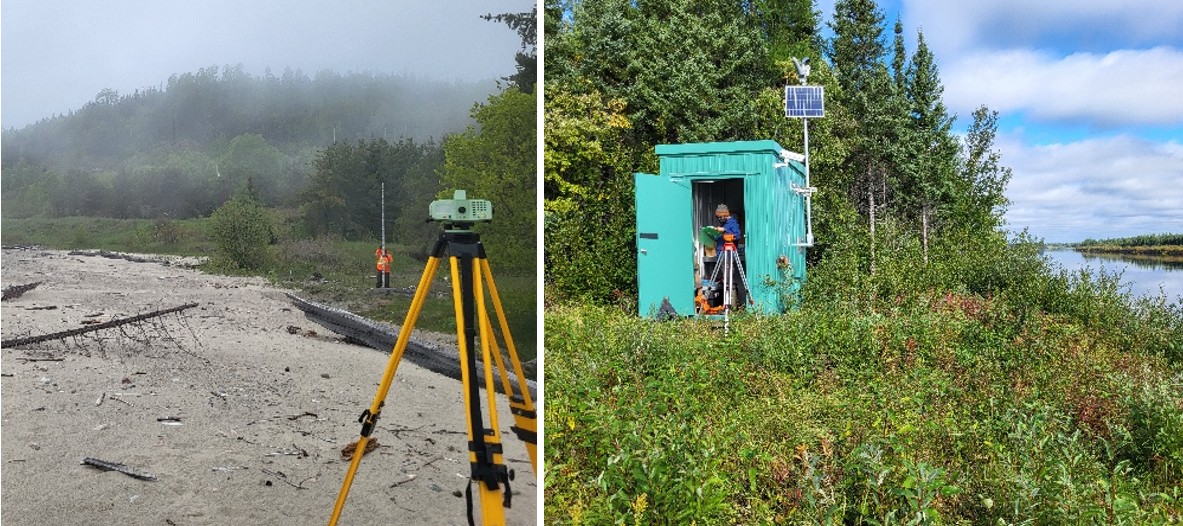
Left: A Hydrometric Technologist holding a levelling rod steady while surveying benchmark elevations (photo by Tanner Booth).
Right: Sean Arruda recording a stage measurement and comparing it to data logger readings at station 04DC001 – Winisk River Below Asheweig River Tributary, 2025-09-10 (photo by Tanner Booth).
Measuring discharge
While stage tells us how high (or low) a river’s water level is, discharge tells us the volume of water moving past a point over time. It is calculated by multiplying together the cross-sectional area of the river, and the water velocity. And while stage data can be collected almost fully by sensors in the water, the most reliable method for measuring discharge is an on-site technologist.
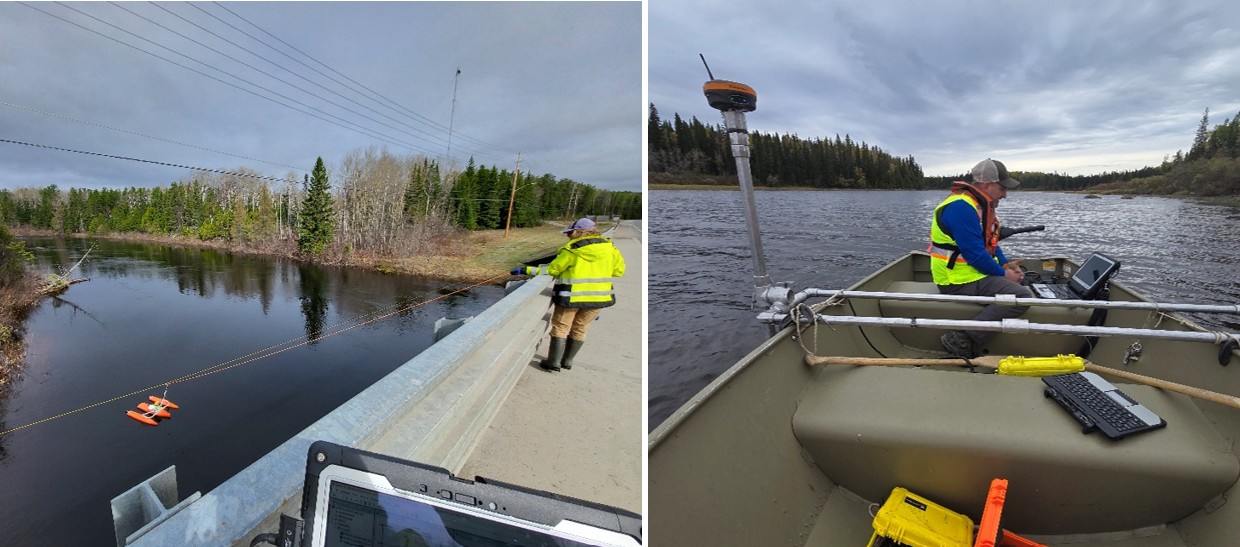
Left: Lauren Bourke towing a tethered boat across the Blackwater River, Beardmore, ON, to measure the discharge with an Acoustic Doppler Current Profiler (ADCP), 2025-05-15 (photo by Tanner Booth).
Right: Craig Paul conducting a discharge measurement by boat, reviewing discharge data as it is being collected on the Otoskwin River, near Pickle Lake, ON (photo by Sean Arruda).
In smaller rivers, technologists wade into the water and use an instrument to incrementally measure water velocity at specific depths. For larger rivers, we use specialized sensors mounted to boats, and sophisticated software which shows us how fast and deep the water is as we move across the river. The data is processed instantly, and discharge is calculated automatically.
Winter adds another layer of complexity. When ice covers the river, we drill a series of holes - usually twenty or more - across the frozen river to measure how the water flows underneath the ice. These measurements are challenging to get but crucial, as they provide a complete picture of the river’s behaviour through every season.
Once we’ve measured both stage and discharge for a station, we then plot the values as a single data point onto a graph called a rating curve. The rating curve graph serves as a predictive model for that specific river. This helps us estimate how much water is flowing, even when we’re only measuring the water level throughout the year.
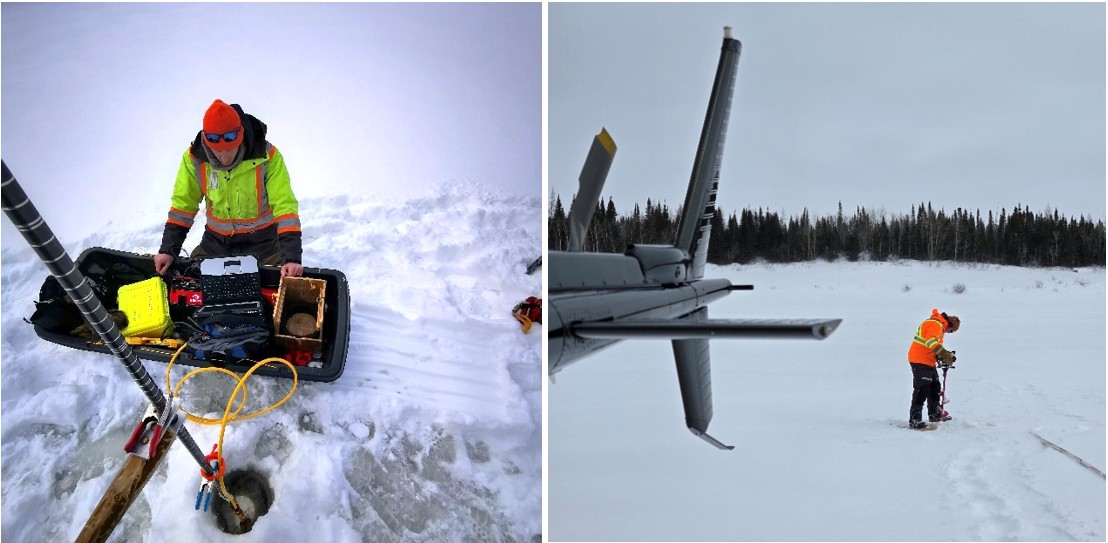
Left: Tanner Booth monitoring live flow data being collected under the ice on the Pic River, near Marathon, ON, 2025-01-16 (photo by Sean Arruda).
Right: Michael Dodd-Smith drilling holes through thick ice cover on the Winisk River, 2025-03-26 (photo by Sean Arruda).
Why It Matters
The data collected through these careful measurements feed into many areas of Canadian life - flood risk management, emergency response, infrastructure design, industrial and agricultural water usage, environmental conservation, climate-change analysis, recreation, and more. Every number in our database represents hours of work in the field and behind the computer, often in very remote and rugged environments.
The data collected is made publicly available at https://wateroffice.ec.gc.ca/, and contributes directly to Canada’s understanding of its waterways, as well as the conservation and stewardship objectives of programs like the Canadian Heritage River System (CHRS). Having a publicly available source of high quality, long-term and nearly real-time water level and flow data helps ensure that rivers and lakes, including the rivers that CHRS celebrates, are understood and managed responsibly. It’s deeply rewarding to know that the work we do helps keep Canadians informed, prepared, and connected to one of our most important natural resources.

Above: Flying over a section of rapids along the Pipestone River, within the Pipestone River Provincial Park, 2024-05-30 (photo by Sean Arruda).